For over 30 years, MDE and the University of Maryland College Park (UMCP) have worked in partnership to conduct policy-relevant research on air quality and climate change. This partnership has often involved collaboration with other states and partners like the National Aeronautics and Space Administration (NASA), the National Institute of Standards and Technology (NIST), the National Oceanic and Atmospheric Administration (NOAA) and other universities like the University of Maryland Baltimore County (UMBC) and Howard University (HU). This collaborative research effort has led to some of the states' and the nation's most successful efforts to reduce air pollution and protect public health.
The partnership with the UMCP has been focused on using the best science-based air quality modeling and aloft air pollution measurements using an aircraft. This research is part of the Regional Atmospheric Measurement Modeling and Prediction Program (RAMMPP). For the past three decades the RAMMPP research has shown that approximately 70 percent of Maryland’s ozone problem on certain days originates from upwind states and the cutting-edge air quality modeling has demonstrated that by reducing power plant emissions in upwind states will dramatically reduce ozone and fine particulate pollution in Maryland. Additional information on RAMMPP aircraft flights can be found here.
In 2002, MDE started collaborating with the University of Maryland, Baltimore County (UMBC). This collaboration focused on using lidar (light detection and ranging) to better understand how particles mix in the atmosphere and are transported into Maryland. You can read more about this research here.
More recently in 2020 Maryland was one of the first states to participate in the Unified Ceilometer Network (UCN) being developed through a combined effort between UMBC, EPA, NASA and NOAA. The ceilometer is a meteorological instrument that can be used to measure aloft aerosol profiles to determine the mixing layer height (MLH). This data will be used to inform air quality modeling and better understand atmospheric dynamics. More information on the ceilometer network can be found here.
MDE started its successful collaboration with Howard University (HU) in 2005. Over the past 15 years HU has launched hundreds of ozonesonde balloons as part of a research effort to better understand and measure how much ozone is present over Maryland in the late night or early morning hours. This research led to the discovery of the nocturnal low-level jet (NLLJ) and ozone being transported into Maryland at night and the early morning hours. To learn more about this important research and to see a video of an ozonesonde launch go to this page.
The Ozone Water-Land Environmental Transition Study (OWLETS – 2) was an intensive collaborative effort during the summer of 2018 to study air quality in and around the northern Chesapeake Bay region. MDE and scientists from NASA, NOAA, and several local universities participated in the study. The study was designed to help figure out why Maryland’s and other eastern states’ most problematic ozone monitors are located close to water bodies, why ozone is high over water bodies, how bay breezes push high ozone over the bay inland and what sources contribute to the high ozone readings over the bay.
Air quality measurement instrumentation was deployed at various locations in and around the bay from June 6 through July 6, 2018. These measurements provided a much needed three–dimensional look at air pollution over and surrounding the bay and will help scientists better understand how ozone is affected by the land–water interface issue.
Surface and aloft pollutant measurements were taken by an assortment of instrumentation. The MDE air monitoring network provided a foundation for surface ozone measurements. Aloft ozone measurement technologies included Light Detection and Ranging (lidar) remote sensing, ozonesondes, tethered balloons, aircraft, satellites, a wind lidar called a wind cube, radiometers, and ceilometers. Additional surface measurements included fine particles, carbon monoxide, NOx, mercury, SO2, and volatile organic compounds. These instruments were located at sites from approximately the Bay Bridge to Aberdeen Proving Grounds. Hart-Miller Island (HMI) and UMBC served as the study’s super sites within the greater experimental network. OWLETS – 2 provided a much needed and unique opportunity to take a combination of air quality measurements over and around the Chesapeake Bay.
After major actions were taken in March 2020 due to the COVID-19 pandemic – including restrictions on the size of gatherings, the closing of schools, mandatory teleworking for non-essential state workers and a Stay at Home Order – MDE and the agency’s long time partners at the UMCP started collecting data and looking at the effect on air quality and emissions of greenhouse gases that contribute to climate change. Researchers found a temporary reduction in vehicle traffic and power plant emissions, along with air quality and greenhouse gas benefits.
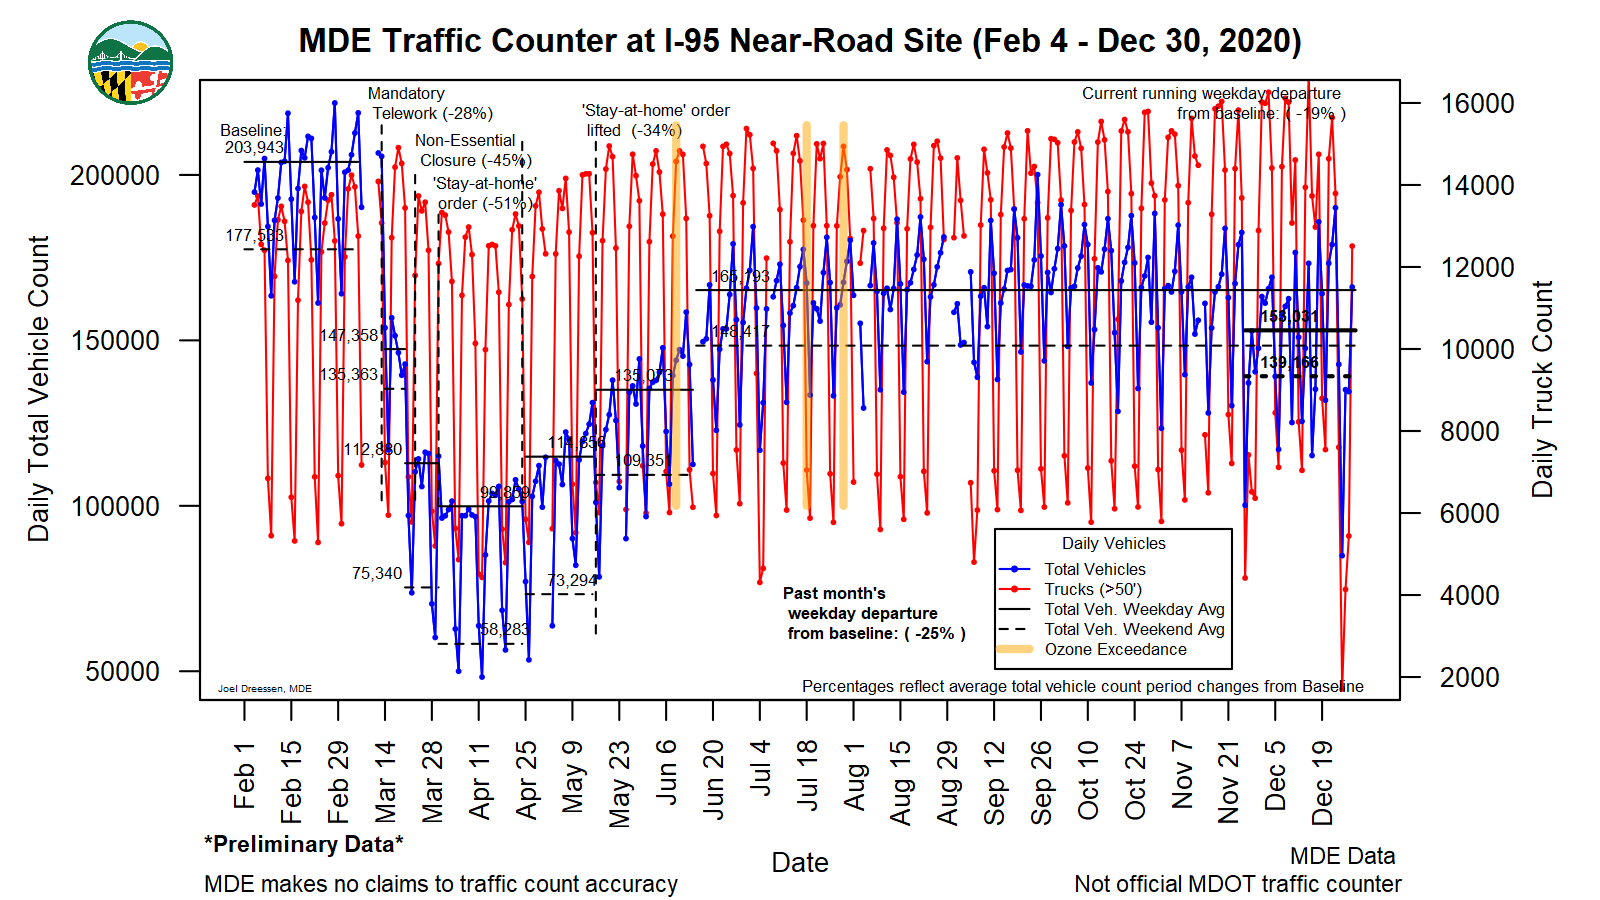
As the COVID-19 pandemic continued through the end of 2020, so did the gathering of data at MDE’s roadside air monitoring station located at the I-95 rest stop between Baltimore and Washington. Light duty gasoline vehicle traffic (cars and passenger trucks) early on were down by approximately 40 percent though it has been steadily increasing back towards levels seen before social distancing measures were implemented. By the end of the 2020 ozone season traffic had rebounded but was still 18 percent (as of Sep 20, 2020) below levels seen prior to the COVID-19 restrictions. Heavy duty diesel vehicles experienced a maximum 8 percent decline during the lowest week in April 2020. However, since March 14th, 2020, truck traffic in general has only been down 2 percent in aggregate and has been at levels similar to the baseline prior to COVID-19 related restrictions.
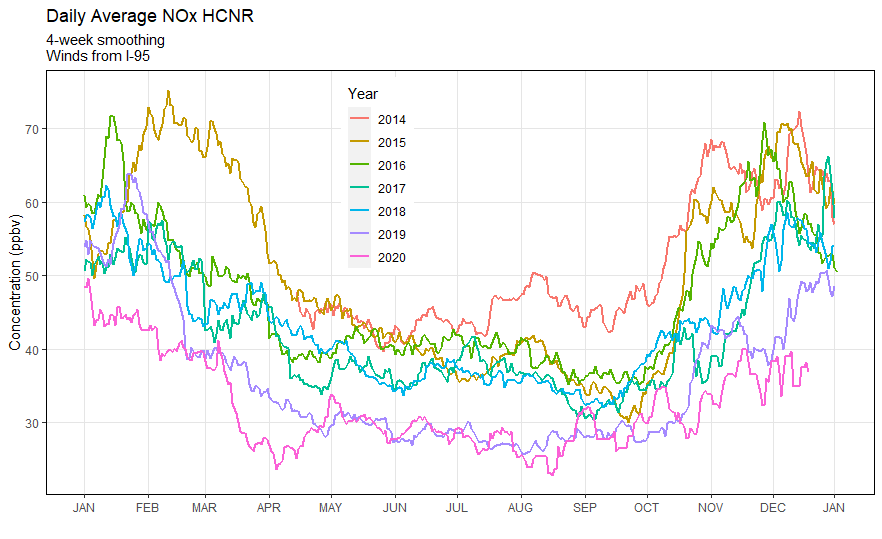
An MDE preliminary analysis of daily NOx data (Feb – Jul, 2015-2020) from the MDE near road site clearly show that NOx has been decreasing for the past few years. A closer look at March 14th – April 30th, 2020 show approximately a 16 percent NOx reduction. This corresponds to a period of below normal vehicle and truck traffic. After May 1st, 2020 there appears to be no year over year difference when compared to 2019. Was this due to the truck traffic returning to normal even though vehicle traffic remained low?
Satellite Air Monitoring During the COVID-19 Pandemic
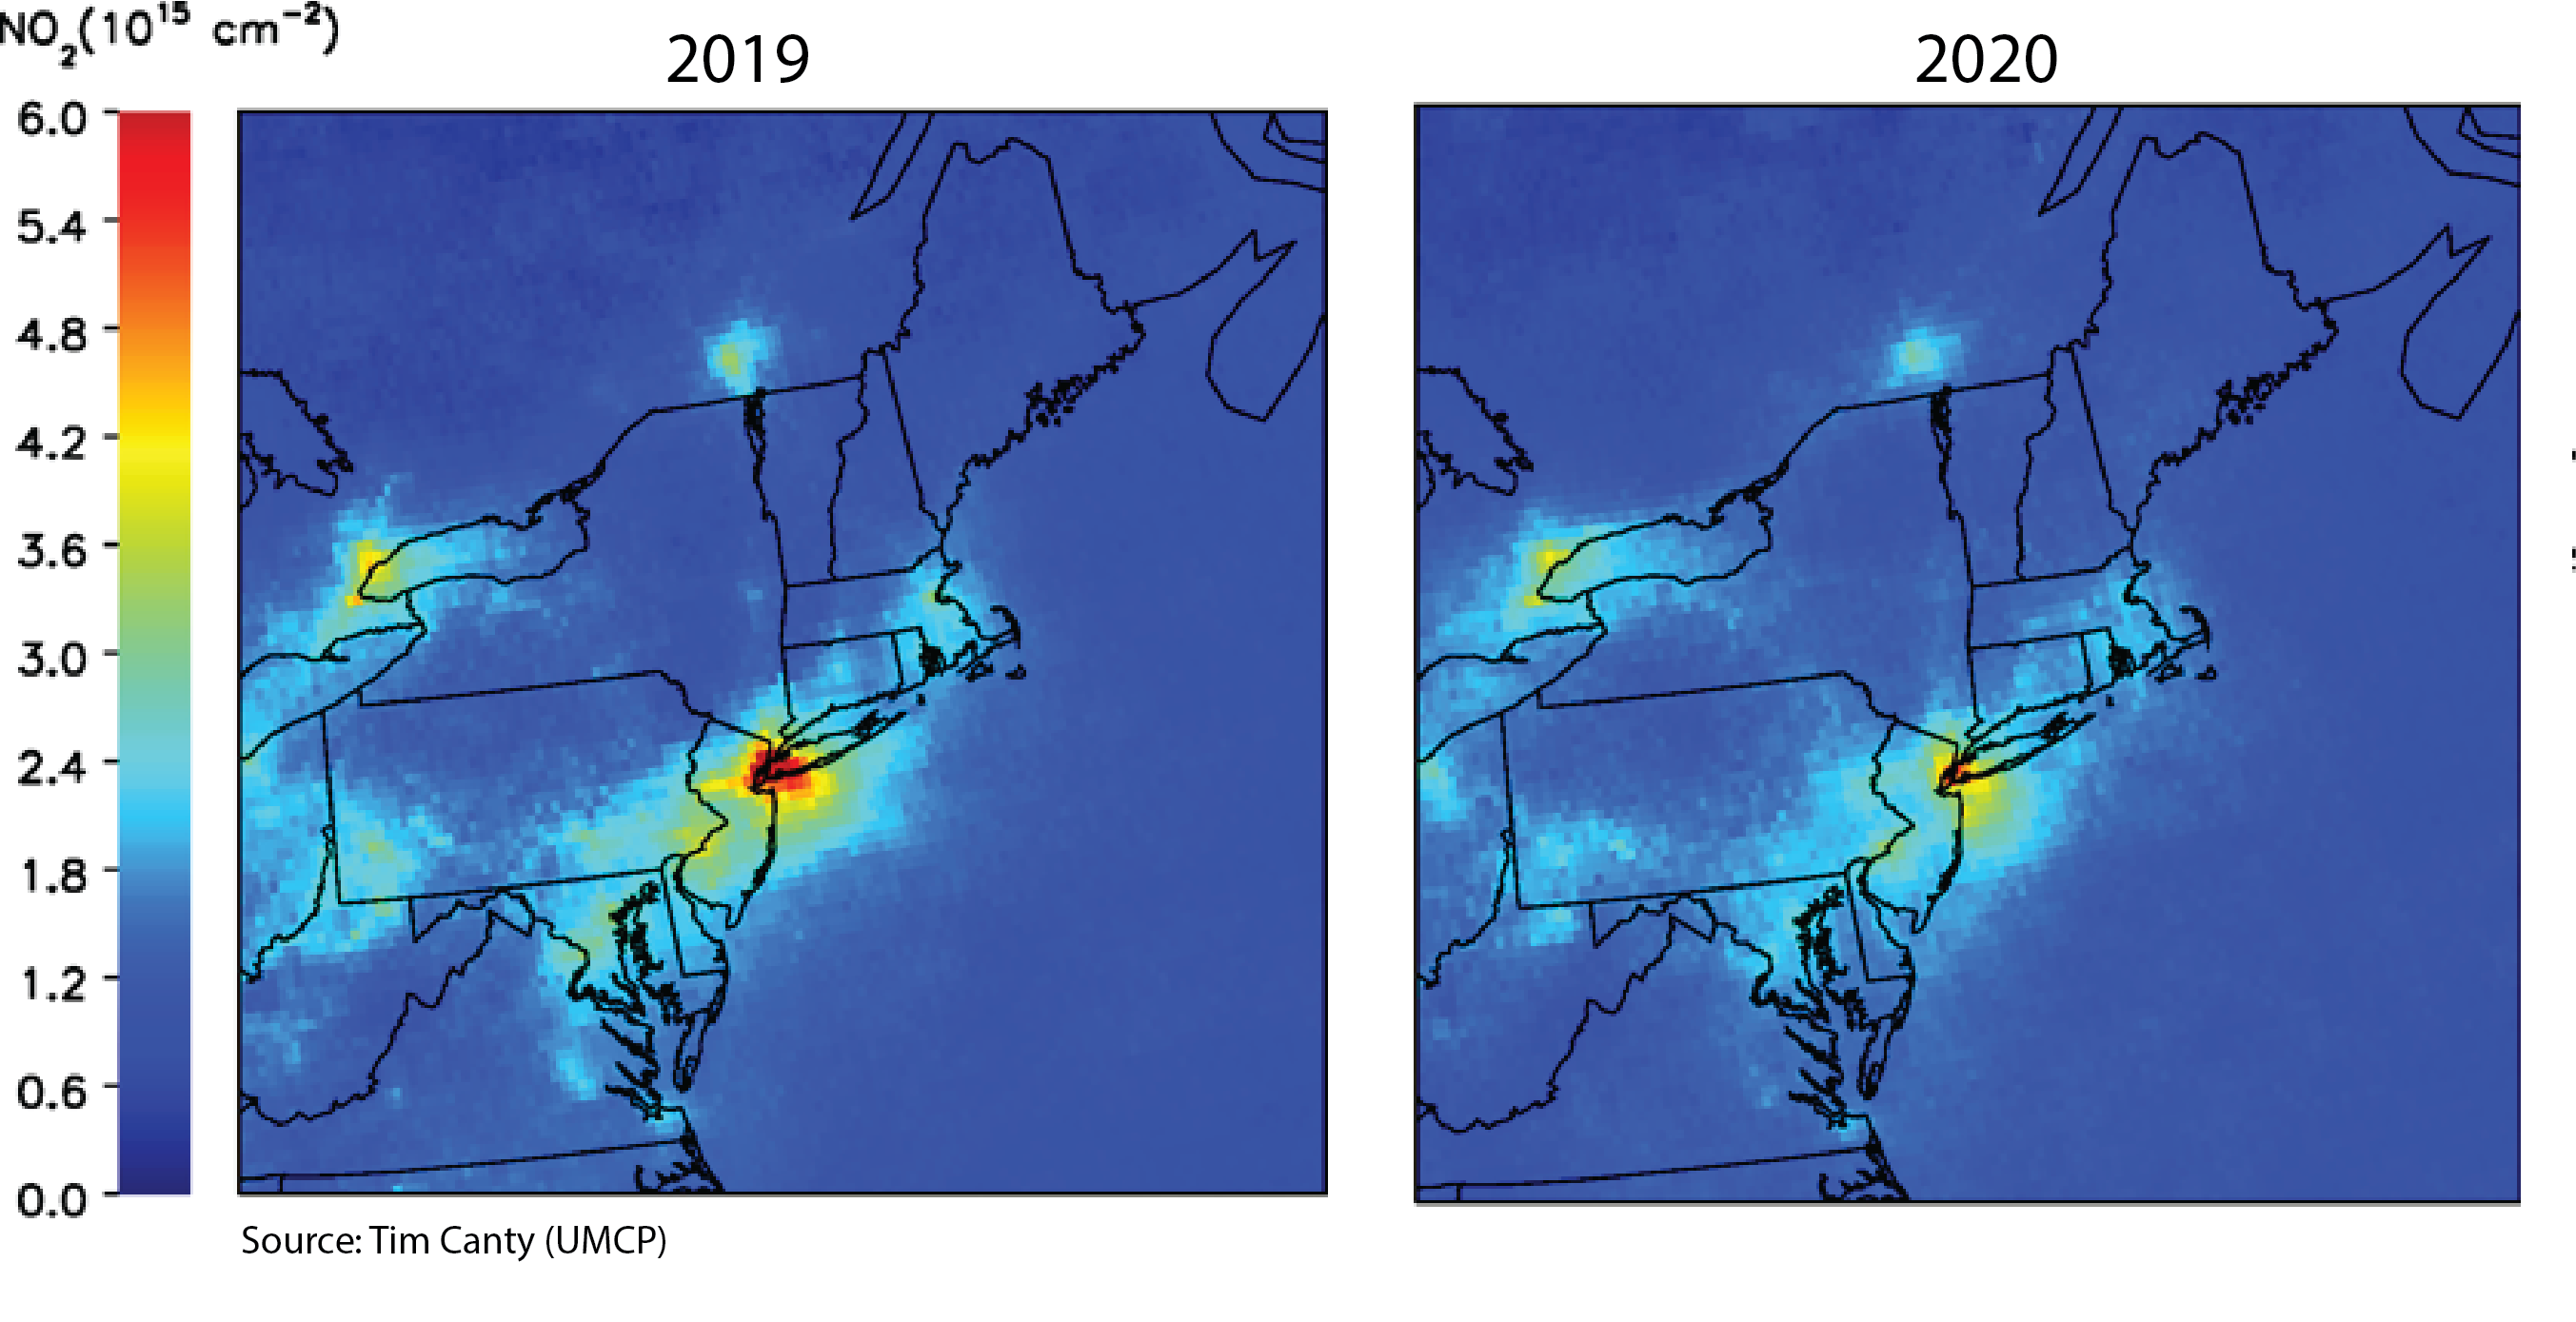
The TROPOspheric Monitoring Instrument (TROPOMI) satellite data has been extremely interesting and is another useful tool to analyze air quality and climate change. UMCP and MDE have worked closely to better understand how the satellite data can be used to identify how and why air quality improved in 2020. The satellite data is a good indicator for changes in emissions of combustion sources (power plants and mobile sources). The data shown below are maps of NO2 for 2019 and 2020. Based on a visual inspection of the two NO2 maps the hot colors (shades of red and yellow) are less prevalent in 2020 as compared to 2019. This corresponds to less pollution in the atmosphere.
The preliminary results provided based on traffic and satellite data is potentially a preview of the benefits that could be expected with a significant increase in the number of zero emission vehicles on our roads and tightened emissions from power plants, along with the benefits of an ongoing emphasis on teleworking when possible. This was all about using the science to inform environmental policy for sustainability and vibrancy.